Mayfield-Graves County Airport (M25)
Barkley Regional Airport (KPAH)
Graves County is served by a reliable network of utility providers across power, water, and telecommunications — giving businesses the infrastructure foundation they need to operate efficiently.
Mayfield Electric and Water Systems
Atmos Energy
For tax rate inquiries, please contact the Graves County PVA or Jason Lemle using the information below.
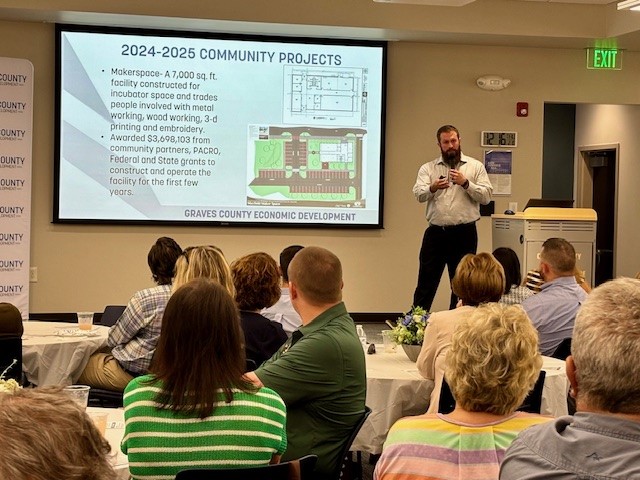
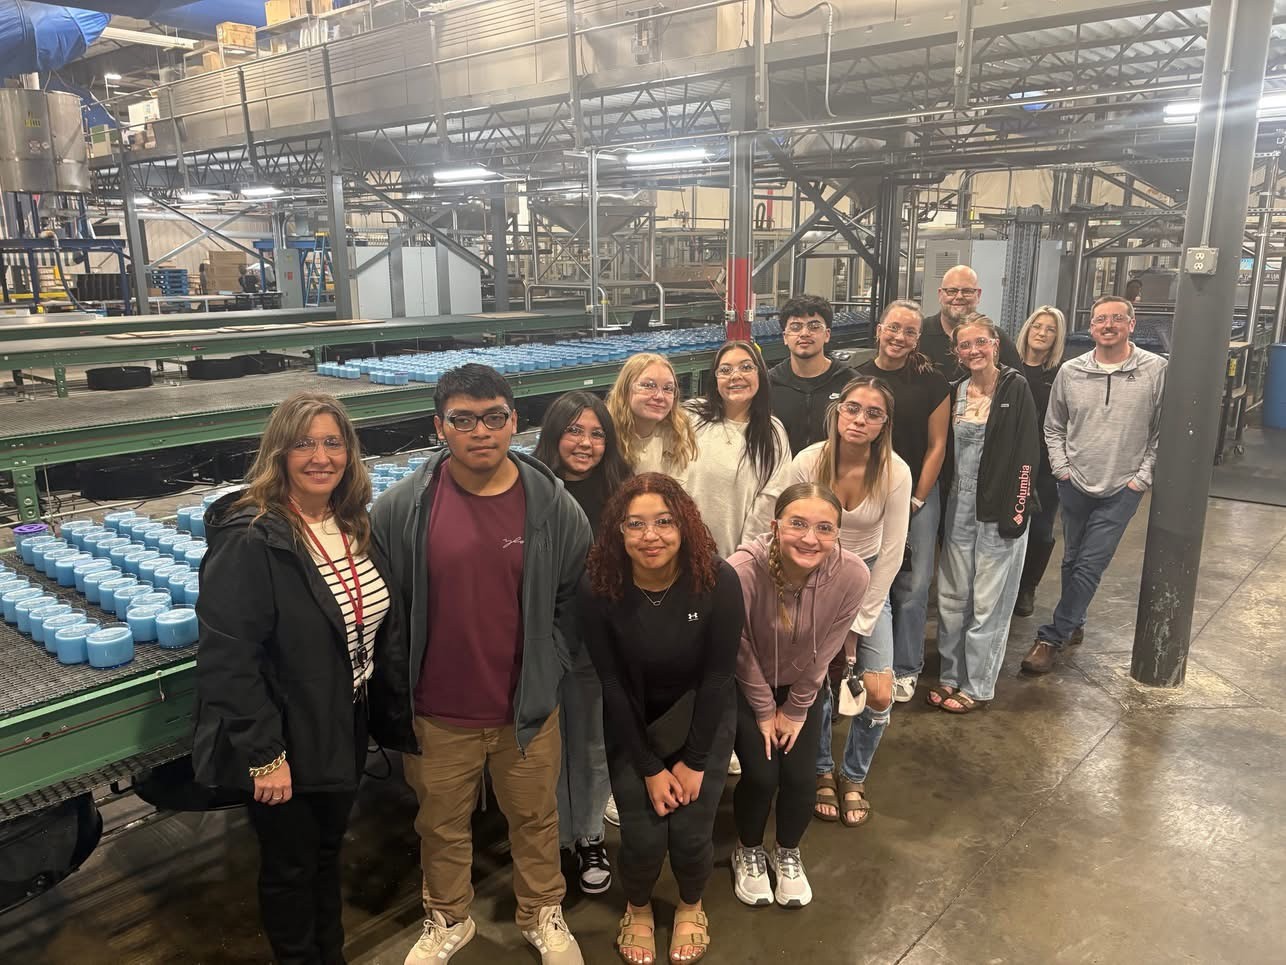
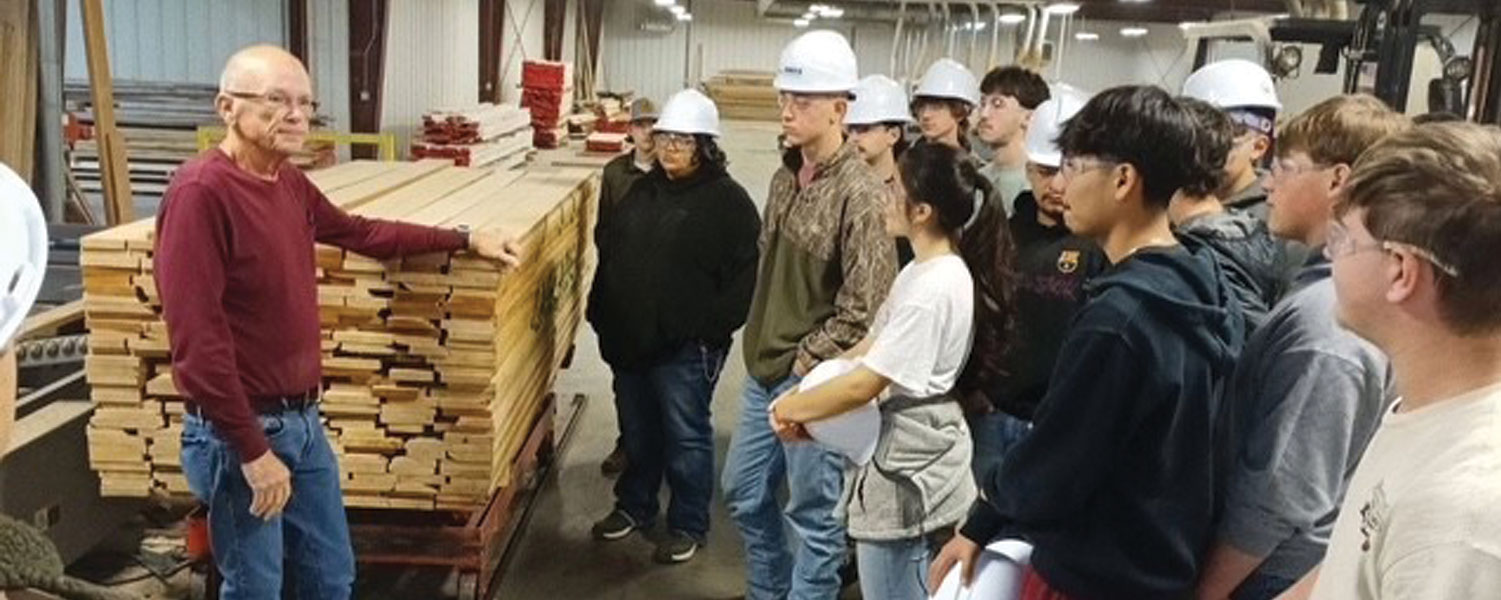
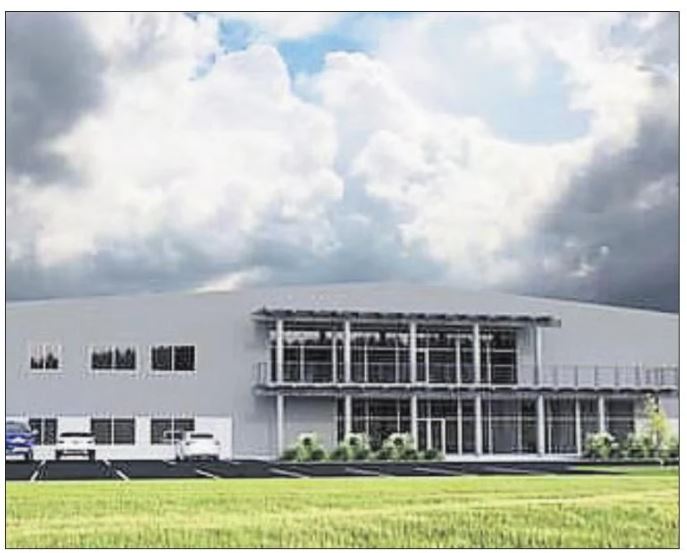
Graves County's diverse industrial base spans advanced manufacturing, food processing, consumer products, lumber, and industrial maintenance — sectors where our workforce, infrastructure, and location give businesses a competitive edge.
Explore key demographic data for Graves County, including population size, composition, and trends, in the tables below.
2020 | 2021 | 2022 | 2023 | 2024 | |
|---|---|---|---|---|---|
Labor Market Area | 356,332 | 355,347 | 355,015 | 356,227 | 356,672 |
Graves County | 36,649 | 36,634 | 36,412 | 36,612 | 36,630 |
Mayfield | 9,729 | 9,971 | 9,894 | 9,905 | 9,868 |
Source: US Census Bureau - 2020 Decennial Census (2020), Annual Estimates of the Resident Population (2016 - 2019), American Community Survey, ESRI
Graves County | Labor Market Area | |||
|---|---|---|---|---|
Number | Percent | Number | Percent | |
Under 15 | 7404 | 20.2% | 43,781 | 17.6% |
15-24 | 4302 | 11.7% | 34,937 | 14.0% |
25-44 | 8690 | 23.7% | 58,323 | 23.4% |
45-64 | 9481 | 25.9% | 63,586 | 25.5% |
65-84 | 6095 | 16.6% | 43,071 | 17.3% |
85 and Higher | 658 | 1.8% | 5,332 | 2.1% |
Source: American Community Survey and ESRI
Industry | Percent of Graves County Workers |
|---|---|
Manufacturing | 17% |
Retail & Other Services | 11% |
Healthcare & Social Assistance | 11% |
Accommodation and Food Services | 8% |
Educational Services | 7% |
Construction | 5% |
Wholesale Trade | 5% |
Agriculture, Forestry, Fishing and Hunting | 5% |
Transportation and Warehousing | 5% |
Source: Jobs EQ 2025 Q3
High School Grad & Higher | Bachelors Degree & Higher |
|---|---|
89.6% | 18.2% |
Source: TVA
Graves County | Labor Market Area | |||
|---|---|---|---|---|
Number | Percent | Number | Percent | |
White | 31507 | 86% | 213,468 | 85.7% |
Black or African American | 1527 | 4.20% | 17,957 | 7.2% |
Am. Indian & Alaska Native | 84 | 0.20% | 528 | 0.2% |
Asian | 171 | 0.50% | 1,936 | 0.8% |
Native Hawaiian & other Pacific Islander | 1213 | 3.30% | 258 | 0.1% |
Other/Multirace | 2128 | 5.80% | 14,882 | 1.3% |
Hispanic Origin | 2983 | 8.10% | 9,925 | 4.1% |
Note: Hispanic is not a race category. A person can be white, black or African American, etc. and be of hispanic origin.
Source: American Community Survey and ESRI
2025 | 2030 | 2035 | 2040 | |
|---|---|---|---|---|
Graves County | 37,768 | 38,002 | 38,170 | 38,295 |
Source: Kentucky State Data Center, University of Louisville
2018 | 2021 | 2023 | Pct. Change since 2018 | |
|---|---|---|---|---|
Graves County | $37,510 | $47,632 | $51,262 | 37% |
Kentucky | $41,974 | $51,266 | $55,360 | 32% |
U.S. | $53,786 | $59,765 | $69,810 | 30% |
Labor Market Area Range | $29,963-$45,391 | $39,424-$56,089 | $54,753-$64,990 | - |
Source: Bureau of Economic Analysis
Number of Households | Persons Per Household | Median Household Income | |
|---|---|---|---|
Graves County | 14139 | 2.55 | $50,772 |
Source: American Community Survey